
S&P 500 CAGR Return
S&P 500 which is short form of Standard & Poor’s 500 is the stock market index that helps the investors to measure the performance of 500 companies (at current 505 companies) that are listed in it. As of September 2022, the top 9 companies listed inside S&P 500 contribute 28% (approx) of the total market capitalization. These top 9 companies are - Apple, Microsoft, Google(Alphabet), Amazon, Tesla, Birkshire Hathway, J&J, UnitedHealth, Exxon Mobil. At present any company listed inside this index must have a minimum market capitalization of $US14.6 billion.
S&P was started in 1941 with only a few companies but from 1957, a total of 500 companies were included. Hence its name was later changed to S&P 500. The maintenance of S&P 500 is handled by - S&P Dow Jones Indices which is part of S&P Global.
From 1928 to 2021 the average annualized return of S&P is 11.82% but after 1957, when 500 stocks were included into this index the average annualized return stands at 11.88%. Although there were lots of ups and downs in the market. The maximum gain in S&P 500 was observed in 1958 of 43.72% and the maximum loss was recorded in 2008 i.e, -36.55%. The COVID-19 pandemic of 2020 crashed the index by -20%.
The S&P 500 index on 15 October 1982 was at 133.57 and today on 12 October 2022 is at 3603.39.
With the help of the our CAGR calculator, we can find out the CAGR for the last 40 years that is 8.63% (without taking the dividends into account).
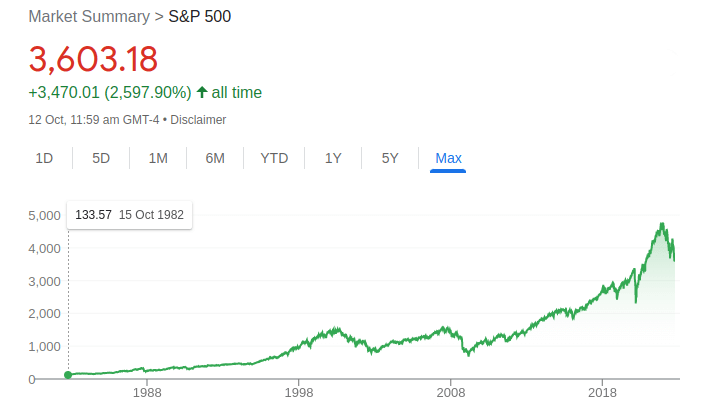
Image credit: Google
Disclaimer:
This website is provided "as is" without any representations or warranties, express or implied. The site provides CAGR (compound annual growth rate) value without any warranty for it's accuracy. All financial decisions should be made with consultation with your financial advisor. This website is not responsible for, and expressly disclaims all liability for, damages of any kind arising out of use, reference to, or reliance on any information contained within the site. By using this website you agree to those terms, if not then do not use this website.